← Back to Overview

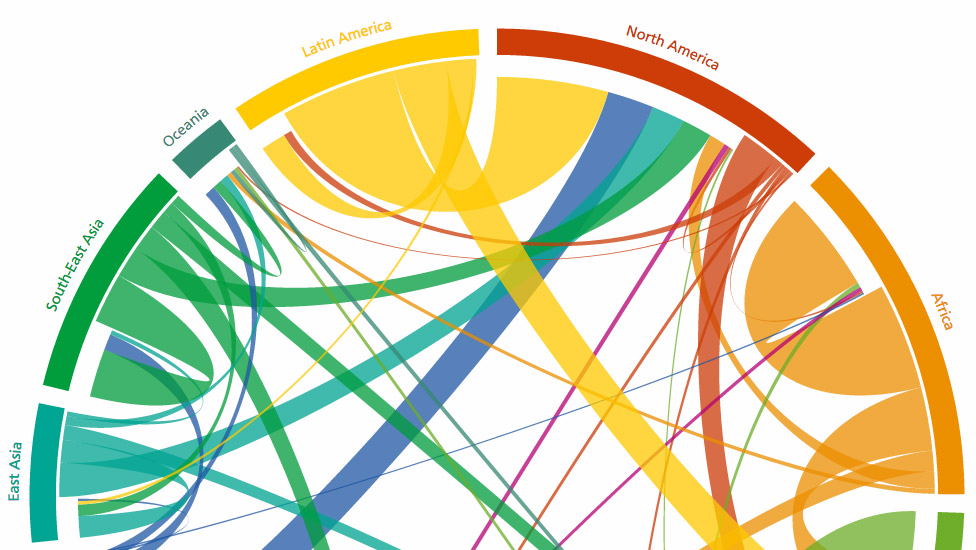
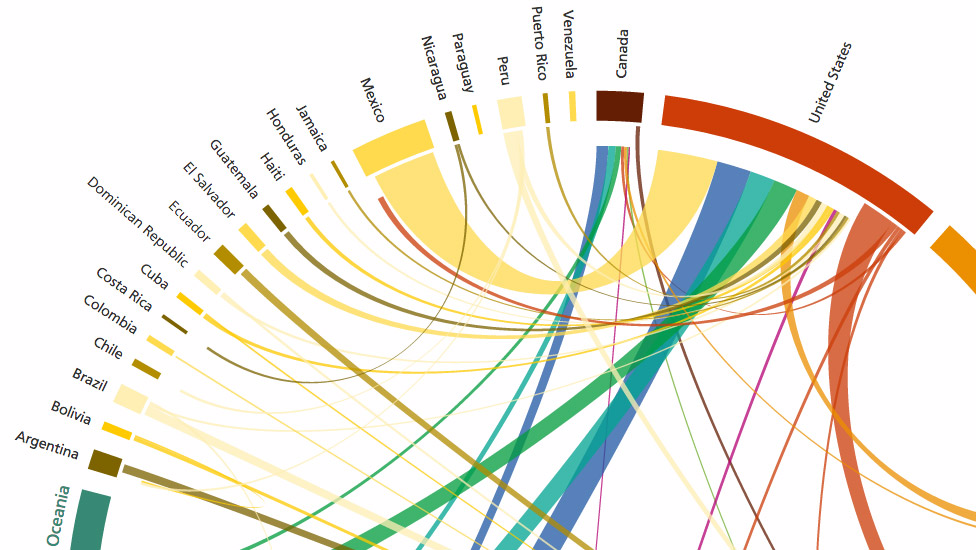
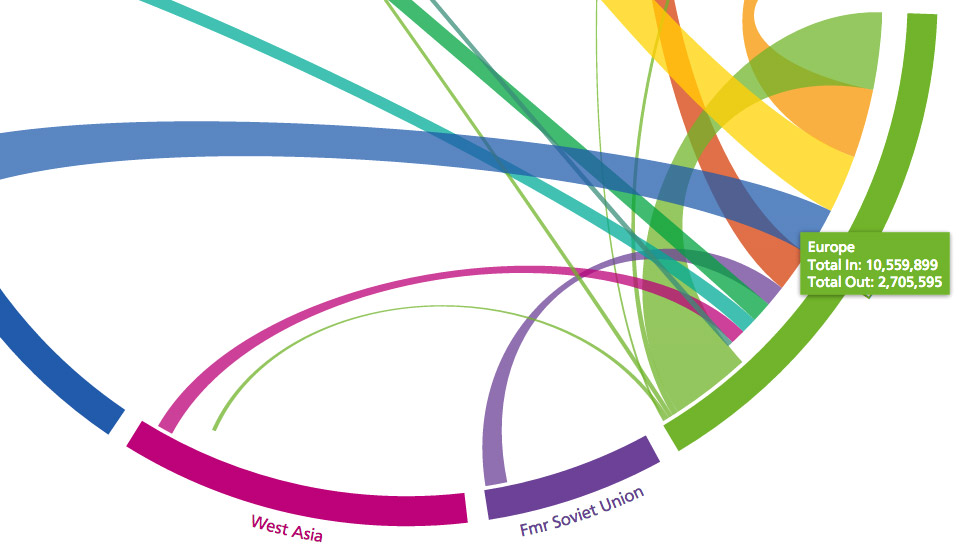
Global Migration
Two decades of global migration flows, beautifully visualised in one interactive chart.
Design: Wittgenstein Centre for Demography and Global Human Capital
Outstanding information design, realised in an innovative way. Scalable, performant and compatible with SVG, Javascript and D3.js
Featured in The Telegraph, Scientific American, Quartz, BoingBoing, Slate and Wired.
"Where everyone in the world is migrating—in one gorgeous chart" QZ.com